How it looks like, if a backend system is flooded with requests from another system?
With Splunk it cool look like that (one day normal traffic and one day with this "little" error):
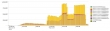 What happended?
We are operating an orchestrated SOA environment and one request type from the frondends forced the middleware to run in something like a loop. Those errornous Requests spreads out into thousands of backend requests (everytime the same one).
How we find it?
We are logging the duration and a custom Transaction ID in our application server access logs. As showed on .conf in Las Vegas ("
Where did that order go? Real World Tales of Purchase and Transaction Tracing") our Transaction ID help us finding erros like this one. We saw that many thousand requests with the same transaction ID was send out for only one frontend request. Without the Transaction ID, we could not find such errors. In that case we would see the big amount of traffic for this domain/services, but not the connection to the causer.
Return of Investment
Calculating the ROI is hard, because this backend scaled perfectly and no request was lost (which is a good value with a factor 9 higher traffic). But finding the error was under 15 minutes. We saw long running request from the frontend, searching for backend requests regarding this frontend request shows the problem directly. Next step was the chart above for showing the increasing traffic for this domain. Fixing this error took a bit longer, due some shakedown tests... but Splunk really helps, and that counts!
This posting is my opinion and did not represent the positions, strategies or opinions from otto or the otto group.
Die Postings auf dieser Site sind meine persönliche Meinung und repräsentieren nicht die Positionen, Strategien oder Meinung von OTTO oder der Otto Group.
