Round about two years ago I bought a house in a new built housing area. The whole areas heating system is powered by a local thermal power station. This station is operated from a contractor. A few months everything went faultless, but then the system produces more and more errors and the hot water changed to cold, which is very refreshing in the morning. :-/ We started talking with our contractor all the time but it seems like they didn't believe us.
This was the starting point to build a temperature monitoring. I ordered a cheap USB 1-wire system in china and a few weeks later a old
NSLU2 with
Debian OS installed generates many monitoring data from the 8 temperature sensors. At the first time I only logged the data into an rrd file and built some nice charts with PHP. Later I decided to check out
Splunk Storm as a different data processor and started sending data with
netcat. That was annoying because my ISP change the ip address every 24 hours and I need to authorize all this addresses. As you can imagine I lost many data because I would not get out of the bed every night. But then the
Splunk Storm API for sending data becomes available and I wrote a script to send the data in key value pairs to Splunk Storm. The script runs as a daemon and sends every minute a set of data. Now it's possible to view my data in Splunk Storm. Let's have a look at some dashboards:
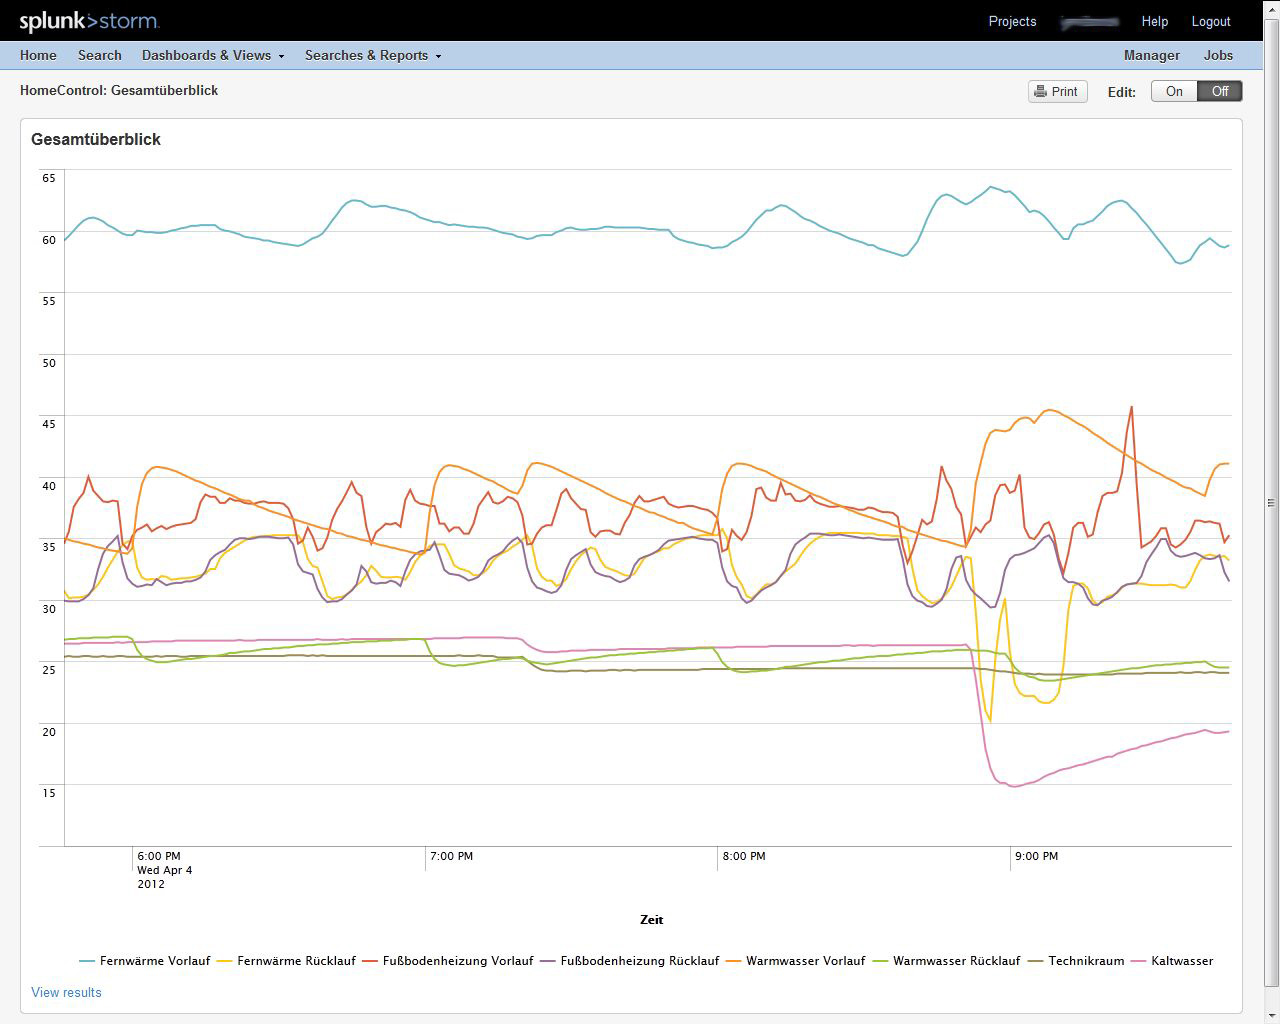
Heating system overview
This chart shows all measured temperatures in one chart.
(Click to enlarge!)
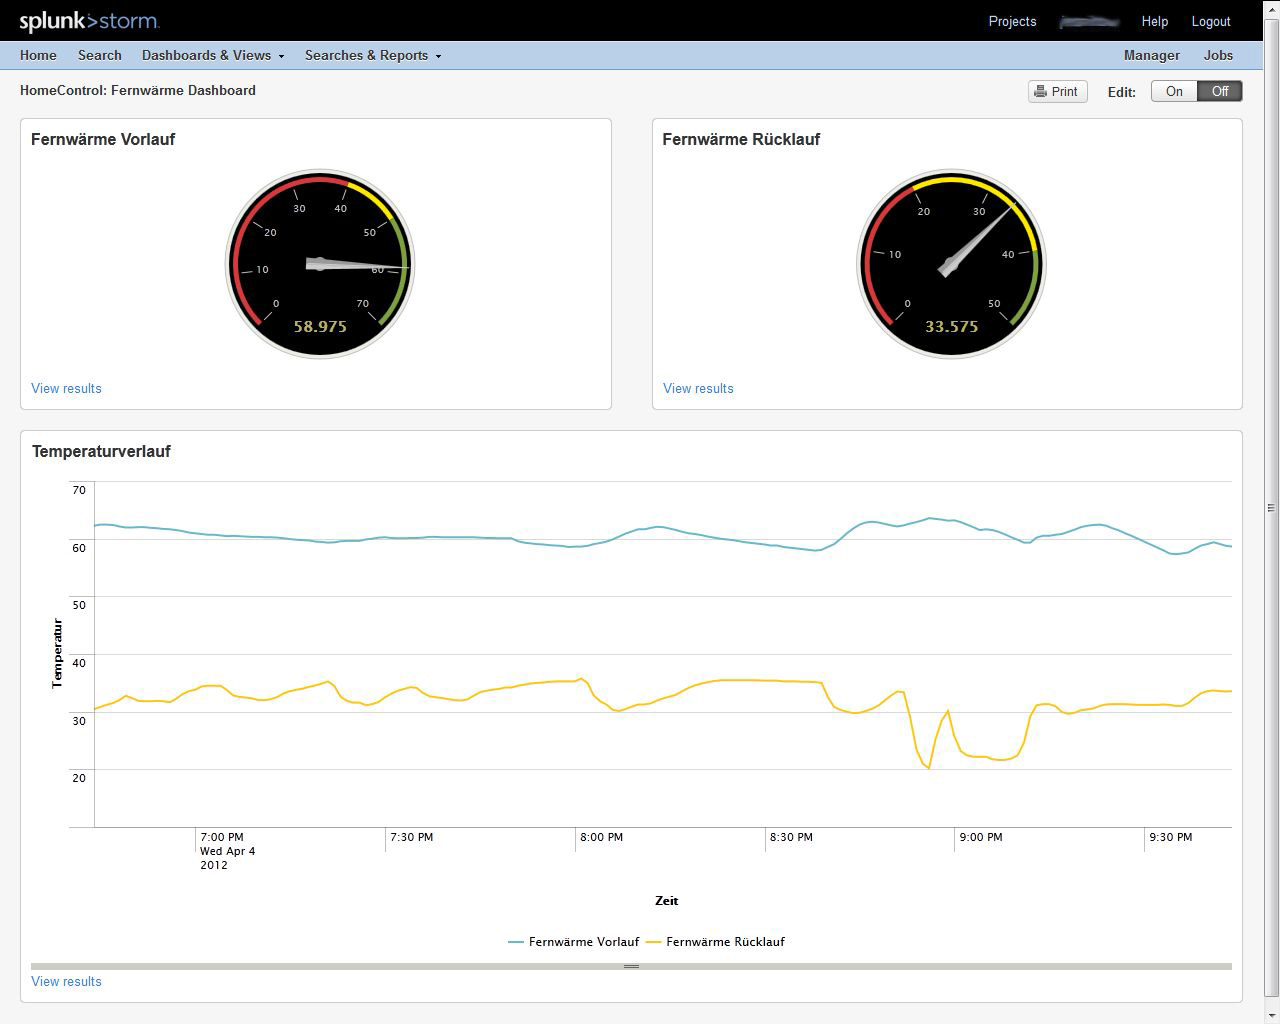
Hot water delivery
This Dashboard shows the flow and return temperatures of the water from the local thermal power station.
(Click to enlarge!)
With the whole data from all sensors I could analyze some interesting things including the point of time and the duration if one of my family members takes a shower. But the really important report is the hot water delivery from our contractor. After a new failure I sent them some charts and they got surprised about the transparency I created. There wasn't any chance to dispute and the whole housing area got a discount on the next bills.
My first successful story with Splunk Storm!
Cheers
Jens
Update:
Next adventure: Monitor the sunshine intensity with Splunk Storm